Hi Baseline Jammers – apologies for the hiatus for the prior year as I started a new job.
As many of you know, I’m a huge OKC Thunder fan, which means we always have the draft to look forward to. This past offseason, I’ve been listening to a ton of podcasts that referred to different “sweet spots” in the NBA draft, and it had me wondering “what are the sweet spots in the NBA draft?”
To help answer this, I decided to dive into the past 20 years of NBA draft picks. My approach for developing a view on where the sweet spots are consisted of developing a 2-by-2 matrix evaluating three dimensions: durability; performance; win shares. I developed two 2-by-2 matrices: one for picks in the NBA draft and one for draft groupings. The 2×2 matrix for picks is straight-forward as it looks at the individual average pick e.g., how does the 3rd overall pick often fare in the prior 20 years of data. The draft group matrix aimed to create & classify groups within the draft and average across the group, through the following groupings:
| Draft Picks | Draft Classifications / Groupings |
| 1 – 4 | Top 4 picks |
| 5 – 8 | Early Lottery |
| 9 – 12 | Mid Lottery |
| 13 – 16 | Late Lottery |
| 17 – 20 | Mid 1st Round |
| 21 – 24 | Mid-Late 1st Round |
| 25 – 28 | Late 1st Round |
| 29 – 32 | Fringe 1st – 2nd Round |
| 33 – 36 | Early 2nd Round |
| 37 – 40 | Early-Mid 2nd Round |
| 41 – 44 | Mid 2nd Round |
| 45 – 48 | Mid-Late 2nd Round |
| 49 – 52 | Late 2nd Round |
| 53 – 60 | Made the Cut |
Both approaches evaluated three dimensions.
The following three dimensions can be further explained as such:
Durability — This dimension would help evaluate a pick and / or the average draft grouping by answering questions like:
- On average, how long was this pick and / or draft group in the league for?
- On average, what was the pick’s and / or draft group’s usage rating?
Durability was scored as an average of two variables that I constructed: a variable that I defined as duration ratio & a separate variable that incorporated usage rate (let’s call this variable on-court usage):
- Duration Ratio: this variable essentially accounted for how long each player was in the league for divided by the total amount of possible years that the player could be in the league. For example, Mario Chalmers was drafted in 2008 (total possible years in the league being 14), but he only played for 9 years which gave his duration ratio a 64%.
- On-court usage: This is a separate variable I determined for durability because I wanted to get an understanding of how featured a player was when they did get playing time. The way I got this variable was by getting each players’ avg minutes played per season (total minutes played divided by the number of seasons played) and multiplied it by their avg usage rate over their career.
These were then provided a score from 1 to 10 for both variables using the MAXIMUM as the upper limit and the MINIMUM as the lower limit for each. The scores would then be averaged since I gave both variables a 50% weight to obtain an overall average durability score.
Performance – This dimension looked at each pick and / or average draft grouping on-court production by answering questions like:
- On average, how efficient was this player?
- On average, how did this player perform from an offensive and defensive perspective?
Performance was scored as an average of four variables: PER; net rating; BPM and VORP, where each variable received an equal 25% weight.
I obtained each pick’s career average PER, their career average net rating, their career average BPM, and finally their average seasonal VORP (e.g., I divided their total VORP by the # of seasons that they played in the league). Similar to durability, I provided a score from 1 to 10 for both variables using the MAXIMUM as the upper limit and the MINIMUM as the lower limit for each.
Win Shares – Finally, the size of the bubble was determined by a pick’s and / or average draft grouping’s average seasonal win shares. I obtained each pick’s total win shares and divided out by the respective amount of seasons that the player played for. Once again, the score was done via the maximum and minimum number of win shares represented in the sample and evenly divided into a 1 – 10 score.
It is important to note that for all 3 dimensions, I would only consider players that would have more than 300 minutes played per season on average (e.g., I took their total minutes played in the league and divided by their total number of seasons played). If it was below 300 minutes per season, I threw their results out because that could really mess up the results due to small sample size.
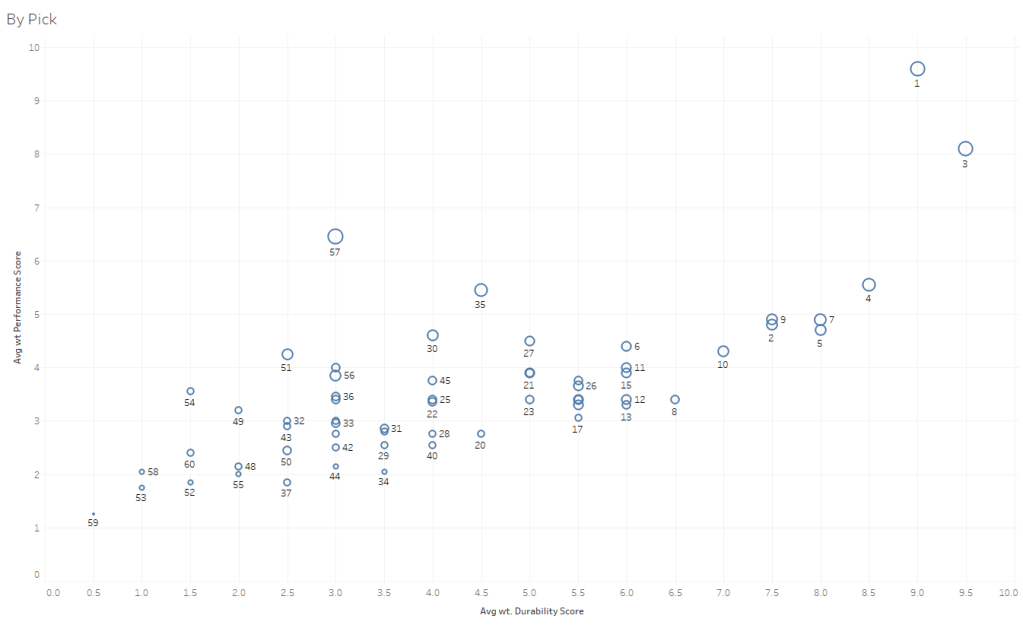
The following is what resulted:
For picks:
For draft groupings:
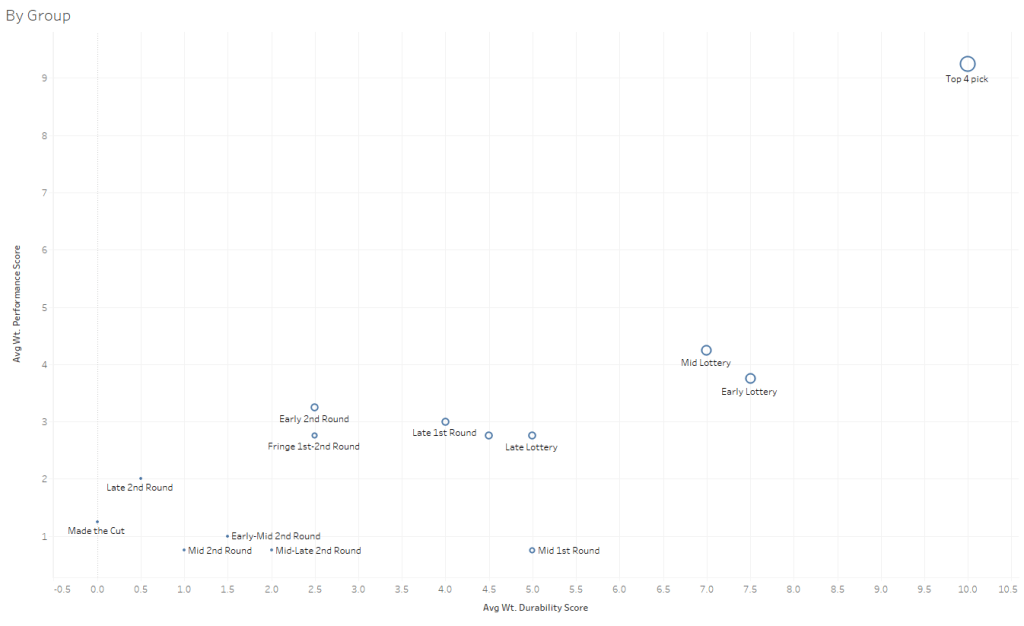
A couple of key takeaways:
- Having a top 4 pick is crucial as their durability and performance is twice as valuable as early- and mid- lottery picks. This comes as no surprise: perhaps the interesting takeaway here is that teams often miss on the 2nd overall pick more so than the 3rd or 4th.
- From a wins perspective, the average win shares per season for a player in this group is 4.1. The remaining 1st round averages about 2 win shares, which means this player will often generate double the win shares than a remaining 1st round player.From an individual performance perspective, the average VORP on a per season basis for a player in this group is 1.4. The remaining 1st round averages about 0.4, which is more than 3x the remaining 1st round average.
- Finally, from a durability perspective, the average minutes played per season x usg rating is 417; whereas; the remaining 1st round picks average 250.
- There’s definitely a trap in the mid 1st round picks as the average performance is similar to the 2nd round picks. They have average durability, but perhaps that’s because GMs aren’t quick to pull the trigger on them because they overinvest in their expectations and / or coaches feel obligated to provide them the minutes because they were drafted relatively high.
- From a wins perspective, the average wins per season is 1.9, which is only slightly better than the 2nd round average of 1.7.
- From an individual performance standpoint, this group has the 4th lowest average PER at 12.9, the lowest average net rating differential of -4.9, and the 4th lowest BPM at -1.6.
- I also noticed that the performance difference isn’t vastly different across the lottery picks, starting with the early to mid, and the remaining 1st round picks (and even as late as early 2nd round picks). This could be because within the scoring system, the top 4 picks are scored so relatively high that we aren’t seeing granular differences in between the ranks. However, this would prove that there’s not really a “sweet spot” in the 1st round as many podcasts have alluded to.
Next Steps: I think what will be interesting with this research moving forward is how we can use this type of model to forecast trade evaluations. The way I’m thinking about this is similar to what a bunch of finance bros know as discounted cash flow modeling with the major question that we want to answer as: How do we know Paul George is worth X amount of 1st round picks and / or how do we know if James Harden is worth Y amount of 1st round picks.
With this, I think we can roughly forecast out a player’s remaining VORP, win shares and other metrics within their career and roughly estimate out how first round picks may result in those same metrics.
For instance, this is PURELY hypothetical, but if Miami is about to trade away Jimmy Butler for a 1st round pick (unprotected) this year, an unprotected 1st next year, and a protected 1st round the year following. We can put probabilities around where Miami will end up in the draft this year (let’s say early to mid lottery) which would provide us a certain avg VORP, win shares, or whatever metric we want to use over the last 20 years of draft history from this analysis. Same thing for the other 2 picks. We would then forecast how many years Jimmy Butler has left in his tank and either do a straight line regression of his production metrics to that point. This can give us a relative idea if trading superstars for 1st round picks are fair or not.
I’m interested to hear if there’s any additional analyses you are thinking about conducting using this as an input e.g., which GMs has historically drafted the best, etc.
Thanks for reading!
