Recently, Ben Simmons took a shot at Rudy Gobert to build his case for defensive player of the year in response to NBA.com’s recent Defensive Player Ladder rankings – to me it was refreshing to see players take pride in their defense in the regular season. I, too, have massive qualms with the rankings (for the full rankings, click here).
My first issue with the rankings is that NBA.com justifies many of their player ranks by the amount of steals or turnovers that a player creates. Although that’s one part of evaluating a player’s defensive capabilities, I think it should be a minor component. How should we evaluate a player’s defensive capability? This question has puzzled many general managers & front offices for some time now, in fact, Daryl Morey has been on record mentioning that the defensive metrics that we utilize today is sub-par.
A common metric that people often use is defensive rating (how many points are allowed per 100 possessions). There are many factors that this metric doesn’t seem to account for. For me, and for the purposes of this post, defensive rating often omits the level of offensive talent that a player is guarding. For example, Lebron James had the third best defensive rating (this data was pulled ~1.5 weeks ago) but it’s well known that Lebron guards the worst offensive player in a lineup during a regular season to often bring help-side defense, which you can later see in the first data visual that I present.
This article will attempt to address a way to bridge defensive rating with matchup data. In doing so, we will dive into some interesting findings and why I believe NBA.com should start putting more respect on Lu Dort’s name. (I also realize how biased this sounds as I am a Thunder fan but hopefully the data provides an objective view).
Methodology
About a week and a half ago (around the start of April 2021), I looked at the top 8 defensive rating players on NBA.com with the filters of (>25 games played & >24 minutes played per game). Centers (namely Rudy Gobert) were included in this initial cut. However, for the purpose of creating an apples-to-apples comparison, I decided to focus on primarily wing defenders. The top 8 at that time were:
- Mike Conley (100.7)
- Patty Mills (101.7)
- Lebron James (103)
- Shake Milton (103.3)
- Kyle Kuzma (103.9)
- Alec Burks (105.4)
- Jae Crowder (105.7)
- Josh Jackson (105.7)
For the purposes of the study, I also included: Lu Dort (111.7); Ben Simmons (107.7); Jimmy Butler (106) and Paul George (106.4).
I, then, evaluated matchup data for each one of these players on NBA.com. I used the filter of playing greater than 10 possessions on the opposing offensive player.
Each offensive player that a defender guarded had to be assigned a value to signify how good the player is on offense. To do this, I examined four input variables: points per game (ppg); PER; offensive rating; and usage rate. I, then, created a tier system for each input variables where each offensive player can be classified into. These tiers are shown as:
| Points per Game | Rank |
| 28.8 – 32 | 10 |
| 25.6 – 28.8 | 9 |
| 22.4 – 25.6 | 8 |
| 19.2 – 22.4 | 7 |
| 16 – 19.2 | 6 |
| 12.8 – 16 | 5 |
| 9.6 – 12.8 | 4 |
| 6.4 – 9.6 | 3 |
| 3.2 – 6.4 | 2 |
| 0 – 3.2 | 1 |
| PER | Rank |
| 30.6 – 34 | 10 |
| 27.2 – 30.6 | 9 |
| 23.8 – 27.2 | 8 |
| 20.4 – 23.8 | 7 |
| 17 – 20.4 | 6 |
| 13.6 – 17 | 5 |
| 10.2 – 13.6 | 4 |
| 6.8 – 10.2 | 3 |
| 3.4 – 6.8 | 2 |
| 0 – 3.4 | 1 |
| Offensive Rating | Rank |
| 121.5 – 125 | 10 |
| 25.6 – 28.8 | 9 |
| 22.4 – 25.6 | 8 |
| 19.2 – 22.4 | 7 |
| 16 – 19.2 | 6 |
| 12.8 – 16 | 5 |
| 9.6 – 12.8 | 4 |
| 6.4 – 9.6 | 3 |
| 3.2 – 6.4 | 2 |
| 0 – 3.2 | 1 |
| Usage Rating | Rank |
| 32% – 35% | 10 |
| 28% – 32% | 9 |
| 25% – 28% | 8 |
| 21% – 25% | 7 |
| 18% -21% | 6 |
| 14% – 18% | 5 |
| 11% – 14% | 4 |
| 7% – 11% | 3 |
| 4% – 7% | 2 |
| 0% – 4% | 1 |
I then looked at an averaged weighted rank value by evenly splitting the weights among the four input variables i.e. Overall rank = (0.25 * rank from ppg) + (0.25 * rank from PER) + (0.25 * rank from off. rating) + (0.25 * usage rating).
As an example, let’s look at the average weighted rank for Lebron James, who scores 25.4 ppg (rank of 8); has a PER of 27.78 (rank of 9); has an offensive rating of 112.8 (rank of 7); and a usage rate of 31% (rank of 9). This provides his average weighted rank as 8.25. I further came up with a tier system:
| Classification of Offensive Player | Average Weighted Rank |
| Ultra-High | 8 – 10 |
| High | 6 – 8 |
| Mid | 4 – 6 |
| Low | < 4 |
Here are examples of players that fall into each classification scheme:
- Ultra-High: Damian Lillard (9.25); Kawhi Leonard (9); James Harden (8.75)
- High: Brandon Ingram (7.75); Khris Middleton (7.25); Collin Sexton (6.5)
- Mid: Eric Gordon (5.75); Brandon Clarke (5.25); Royce O’Neale (4.75)
- Low: Deni Avidja (3.75); Josh Okogie (3.5); Isaac Okoro (3.5)
Matchup stats provides the total amount of time that a defender was guarding a specific player. I essentially created a sumproduct, multiplying the matchup time by the average weighted rank of that player and dividing by the total matchup time. For example: let’s assume I’m evaluating Kawhi Leonard as a defender. For the purposes of explaining, let’s say his matchup data reads:
| Player | Matchup Time (min) | Offensive Player Average Weighted Rank |
| Damian Lillard | 40 | 9.25 |
| James Harden | 24 | 8.75 |
| Khris Middleton | 20 | 7.25 |
Then, on average, Kawhi Leonard would guard a caliber of a ranking of 8.6. This is shown as:
8.6 = [(40*9.25)+(24*8.75)+(20*7.25)]/(40+24+20)
This means on average, Kawhi Leonard would guard an ultra-high player in a regular-season game.
Results
Below is a plot that shows a player’s defensive rating versus the average weighted rank of the offensive player that the defender would typically guard. The size of the bubble will also show the versatility as it represents the standard deviation of the pool of opposing players’ heights. For example, Jae Crowder will often guard an opposing 6’8” +/- 1.5”. Ben Simmons had the highest versatility has he often guards players with an average height of 6’6” +/- 3”. Mike Conley has the best defensive rating in the NBA with 100.7 but on average he guards players with an average weighted rank of 5.7. Meanwhile, Lu Dort has the worst defensive rating in this sample size (111.7) but he guards players with an average weighted rank of 7.1.
Discussion
As I initially mentioned, I don’t think Lu Dort is getting enough defensive praise by the writers at NBA.com. I was severely disappointed that he wasn’t even included in the top 10 ladder. I’m not here to make the argument that he deserves defensive player of the year. However, if we are examining individual defensive performances (since so much of defensive player of the year is all about how a player can serve as the anchor of a defense i.e. Rudy Gobert, Draymond Green, etc), Lu Dort is putting on a show.
Just how starkly different are the challenges that Lu Dort is undertaking compared to others in the top 8 of defensive rating on a nightly basis is understated. Mike Conley guards a high and ultra-high caliber player 15% of the time. Let’s go on the other end of the spectrum and think about Ben Simmons. Ben Simmons guards a high and ultra-high caliber player 68% of the time.
Lu Dort? 83% of the time, he will guard a high and ultra-high player as shown in the schematic below.
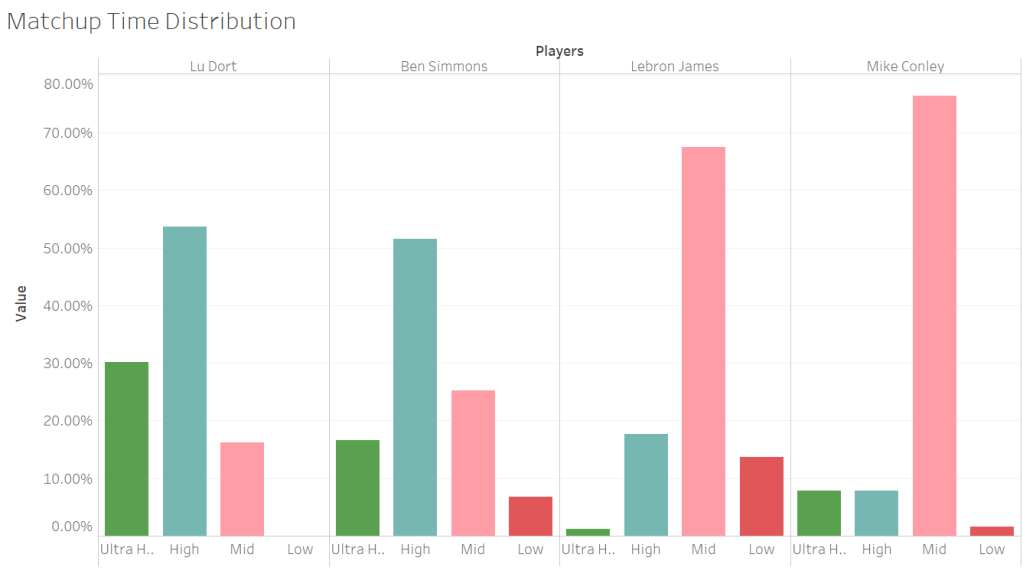
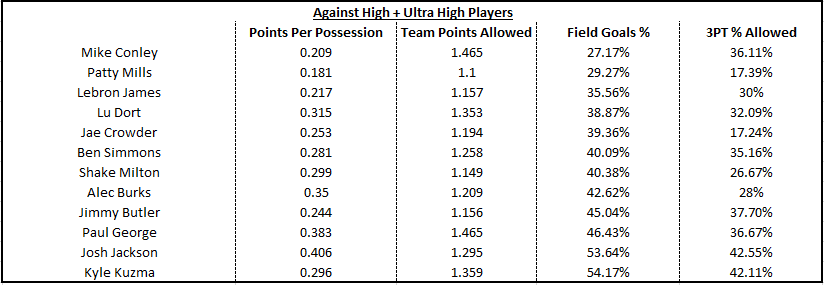
So he guards the most challenging assignment day-in and day-out, so what & who cares? Let’s take a deeper dive and look at the field goal % allowed when a specific defender is guarding a high and ultra-high caliber offensive player? Want to take a stab at what field goal percentage is allowed by Jimmy Butler & Paul George when they guard a high and ultra-high caliber offensive player? They both allow ~45%. What about Ben Simmons? He allows 40%. Lu Dort allows 35% field goal percentage to players that are high and ultra-high caliber offensive players at an insane clip of guarding these players 83% of his matchup time as shown below:
Conclusion
Looking at defensive rating to determine a player’s defensive capability has shortcomings because it doesn’t take into account the challenging assignments that players like Lu Dort undertake on a nightly basis. A step in creating a holistic defensive metric has to consider how to bridge NBA.com’s matchup statistics with the metrics that exist in the status quo. I hope that this approach sparks innovative ways in doing so, but by no means do I defend that my methodology is super accurate (at the end of the day, things like the weights of each input variables can be refined, etc). Although Ben Simmons and Rudy Gobert rightfully deserve defensive player of the year conversations, we need to be more detailed in the way we view data to make sure players like Lu Dort rightfully receive the same amount of attention. If you’re interested in the approach, please feel free to reach out. The gold mine for NBA analytics has long been “how to look at defensive metrics” and I’d love to help out!
