Before I dive in, I want to reiterate an important donation campaign that is ongoing where we were able to partner with a Chicago organization GiveNkind (check them out here: givenkind.org) to fundraise new basketball shoes and basketballs to be distributed out to children who participate in non profit organizations like Girls in the Game (check out the awesome non-profit here: https://www.girlsinthegame.org/ ). It would mean the world if you all took 5 minutes to read about the great work that both these organizations do, and in spirit of the holiday season, if you want to contribute a donation, please click here: https://www.gofundme.com/f/basketball-shoes-givenkind . Thanks for sharing your love of basketball with our future generations!
Baseline Jammers! Happy Holidays!
Back in late August-September, I raced back home from work on a daily basis to catch any of the bubble action that I could find on TV. To those who don’t know, the bubble was the NBA’s answer to the pandemic in concluding the 2019-2020 season by having players play in an isolated Disney World. Watching the game felt much different than the obvious reason of not having fans physically there in the arena—for me, my first observation was based on watching Andre Roberson, a career 25% 3 point shooter, make open three point shots. Then, as the bubble regular season games progressed, I felt like far more players were making outside shots than normal. That observation piqued my interest in diving into the data splits of pre-bubble play vs bubble play for the 22 teams that were at the bubble. This study will attempt to identify and draw generalizations on the main differences in play when teams play in front of fans versus when teams play without fans.
Let me lay the groundwork before diving into the numbers
- Concerning the source of the data, I pulled from Basketball Reference.
2. I excluded playoff numbers. Playoffs introduces an additional variable as teams often play differently in the regular season vs playoffs (although this is a widely accepted assumption, check out Ben Falk’s article here: https://cleaningtheglass.com/why-are-these-games-different-from-all-other-games/ )
3. I conducted a paired T-test on the data set for before bubble and the data set for during the bubble. For those unfamiliar with a T-test, the simplistic way of explaining it is that this statistical methodology measures whether a change is a real change or a change that’s within the data set’s noise or variance. It essentially tests a hypothesis—the hypothesis here being that there’s a difference between the regular-season play with fans versus the bubble play without fans.
Note: For the statisticians in the house that are curious, the alpha level coefficient was set at 5%
4. The following results will be generalizations—there are specific team instances that may drive change and differences in the data that may not be due strictly to “playing without fans” vs “playing with fans.” For instance, the Wizards didn’t play with Bradley Beal, the team’s star player. Just keep that in mind when I discuss certain trends that I saw.
Let’s dive into those trends then!
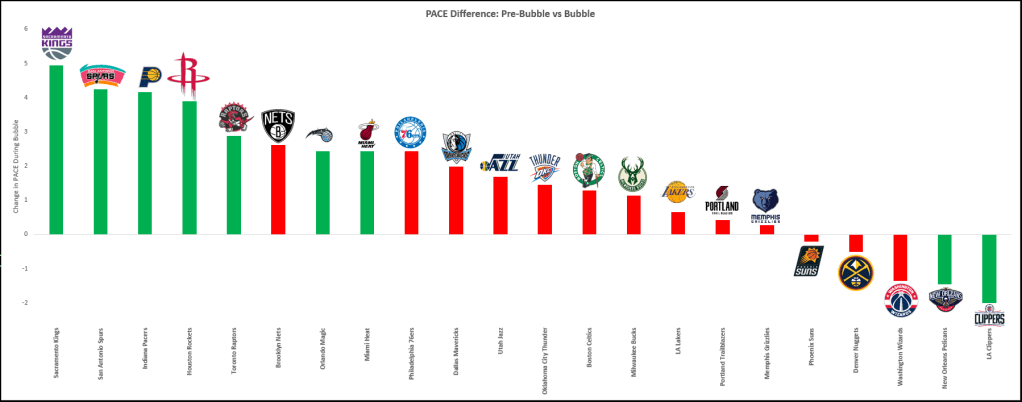
PACE
For those unfamiliar with the PACE metric, the simplest way to explain it is that it’s the metric that accounts for the total possessions (both teams) in a game. The faster a team plays, the more possessions it get.
The biggest difference in the two environments was that the bubble (playing without fans) had an uptick in PACE, where the 22 teams collectively averaged an increase in the PACE metric by 1.5, which reasonably paves way for the assumption that players seemed to be playing much faster without fans. The visual below better demonstrates the differences. A positive bar will indicate that the team had a higher PACE in the bubble than pre-bubble. A negative bar will indicate that the team had a lower PACE in the bubble than pre-bubble. The green color will indicate that the change is considered a significant and real change, not one driven by noise in the data. The red color will indicate that the change can be potentially described by chance. 17 of the 22 teams played with a faster pace during the bubble compared to before, where 7 of these 17 were considered to be real, significant changes in the data.
Some hypotheses for why there’s an uptick in pace:
- There’s no travel taking place. There’s been countless records of players (like Damian Lillard) who have talked about how flights on back-to-backs alter their sleep schedules, thus their energy in play. The bubble fundamentally takes travel out of the picture, so I believe players could potentially be more rested.
- Players were rested from the 4-5 months of break in play that they had. Although this is a potential reason, I also compared data from the first ten games of the regular season as a good proxy and noticed that the bubble was still far higher in pace than those initial games, which leads me to believe this reason has less credibility.
- No fans—players often feed off energy from their fans. From a personal perspective, I tend to play better defense when people are watching me: my friends would joke that this change is from giving up wide open shots to being 3 feet away to contest. So, my hypothesis here is that the lack of fans allowed players to play with less defensive energy, which often gave way to a faster paced game. So let’s look at that.
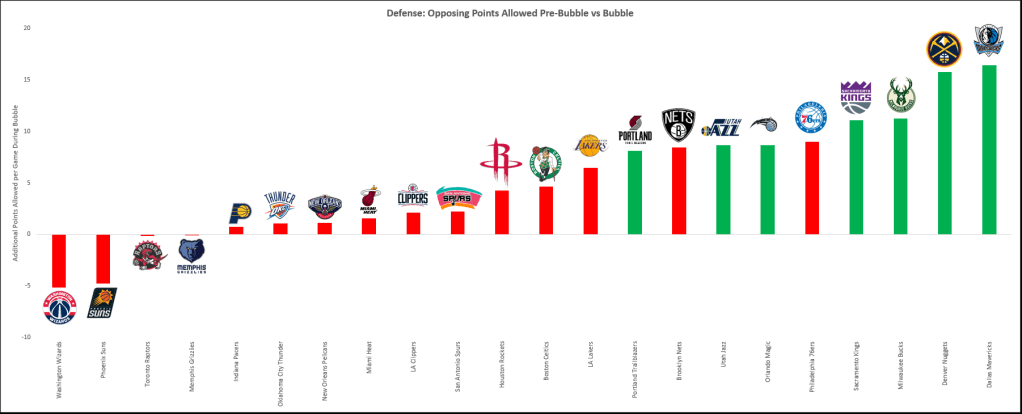
Defense
As suspected, 18 (7 of which exhibited real, significant changes between the data sets) of the 22 teams actually played worse defense in the bubble compared to playing in front of fans. On average, the 22 teams were giving up an additional 5 points per game in the bubble than before. It is important to note that this could be a chicken and egg conundrum where we don’t know if bad defense is causing faster pace or if faster pace is causing more points to be scored, thus worse defensive results.
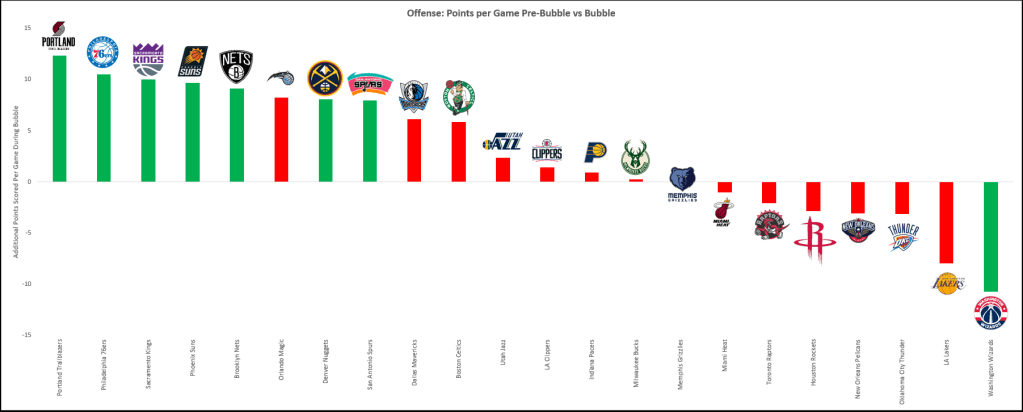
Offense
Somewhat surprisingly, the improvements in average points scored on the offensive end were a bit more modest than the change we saw in defense. 14 of the 22 teams exhibited more points scored in the bubble than in the regular season, where half of these teams exhibited a real, significant change in the data. The net result for bubble play was an approximate increase of 2.8 points scored per game for the 22 teams.
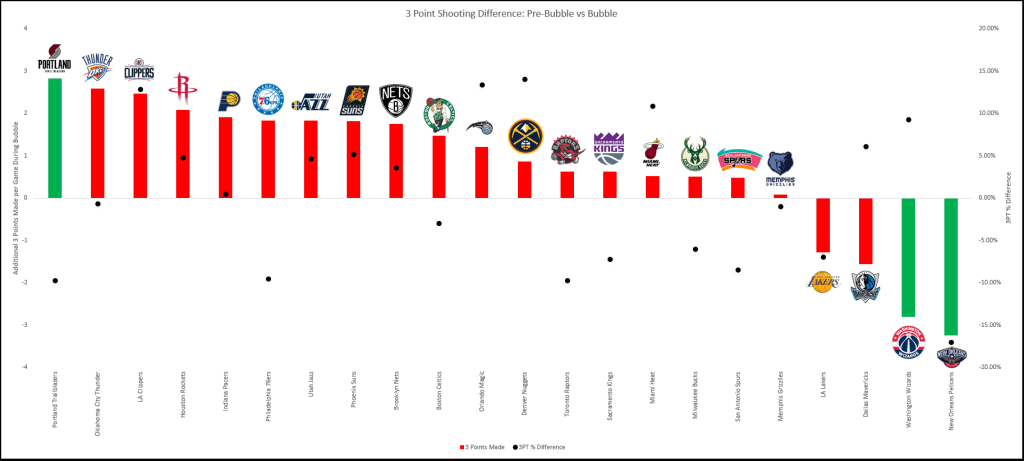
Shooting
The uptick of ~3 points additionally scored per game in the bubble seems to correlate pretty well with some shooting statistics. I dived into the total additional 3 points made per game along with 3 point shooting percentages. If you look at the visual below, 18 of the 22 teams actually made more three point shots during the bubble than before. The collective teams in the bubble averaged out to be making about one additional 3 point shot during the bubble than before.
This visual adds black dots that correspond with the secondary axis, 3-point shooting percentage. Teams weren’t necessarily making additional three point shots because they were shooting better, as I originally suspected. Actually half of the teams shot worse than before the bubble, and the other half shot better. I believe that we saw an uptick in 3 points made because teams were just getting more possessions (uptick in PACE).
Concluding Thoughts
This initial look at the data sets showed that teams were playing much faster in the bubble. Teams were also playing worse defense in the bubble as well. The causal relationship between the two is unknown. Teams could be playing faster because there was worse defense, thus more possessions, or teams’ defensive metrics were inflated because teams were playing faster. My original hypothesis that teams were shooting outside jumpers better seemed to be debunked as 3PT % didn’t show any major trends.
I think it will be interesting to see what occurs this upcoming season as teams continue to play without fans. Pace has historically increased throughout the history of the NBA: will we even see a sharper rise in PACE for the 2020-2021 season?
Thanks so much for reading, and once again, please be sure to check out the donation campaign this holiday season. That said, I hope everyone enjoys their holidays! If you enjoy some of my content, please be sure to follow as I intend to post more frequent content.
