The Oklahoma City Thunder’s front office is annually appraised as one of the better front offices in the NBA. One way to measure a front office’s success is to examine players’ contracts and correlate those to players’ contributions to the team’s success. In this post, we will examine if each Thunder player outperformed his contract for the 2017-2018 season by looking at an advanced metric called “win shares.”
What are win shares? Win shares are how many wins a player has contributed to his team for that particular season. Russell Westbrook recorded a 10.1 win share for the 2017-2018 season, which means Russell contributed roughly 10 wins to the Thunder’s season.
How are win shares calculated? For reasons too convoluted, we won’t delve into the mathematics of the calculation, but win shares are a combination of both offensive and defensive win shares (these formulas would incorporate parameters like points produced by each player, defensive rating, etc). For an in-depth look at the calculation by visiting here: Calculating Win Shares
Why examine win shares? The goal of each team is to win games. Each player is an asset or resource to obtain those wins: contracts are the investments that teams have paid to obtain each asset. Therefore, to understand how efficient each asset is, it’s best to examine win shares. There are implicit assumptions behind this model:
- Revenue Generation Limitations: This model will evaluate a contract solely on wins generated. However, evaluating contract values extend beyond wins generated: players can generate revenue by jersey sales for instance, in which this model doesn’t take into account.
- Games Played Limitations: This model also evaluates a contract by the amount of games a specific player has played. For instance, Andre Roberson didn’t play up to his true contract potential due to an injury. To remedy this, a second model of “adjusted win shares” by extrapolating 48 minutes win shares is also evaluated.
- Eligibility: Lastly, eligible players had to have win shares greater than 0.0. A player like Kyle Singler was not evaluated. Also, two-way players like Daniel Hamilton and PJ Dozier were also excluded.
The Model: what parameters were evaluated?
- Salary/Win Share: This value is how much the Thunder franchise has paid each player to generate one win share. In part 2 of this series, we will utilize this parameter as a benchmark to compare to similar players throughout the league.
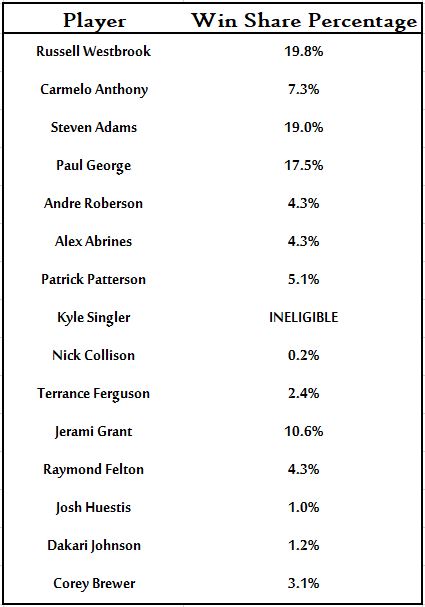
- Win Share Percentage: This value is the ratio (as percentage) of win shares that each player contributed to the total team win shares. For instance, Russell Westbrook recorded a win share of 10.1. The team’s total win shares of eligible players totaled 51 (which is roughly close to the 48 actual wins that the team recorded). Therefore, Russell Westbrook contributed 19.8% (10.1/51 as a percentage) to the team’s total win shares.
- Salary Share Percentage: This value is the ratio (as percentage) of each player’s contract to the total of team’s salary (this did include Kyle Singler’s contract since ~$5 mil isn’t a negligible value). As example, Russell Westbrook’s contract last year was $28,503,608 and the team’s total salary expenses of eligible players + Kyle Singler’s contract was $131,335,160. Thus, Russell’s share of the total team’s salary was 21.7% ($28,503,608/$131,335,160 as percentage).
Win Share Percentage: Below is a table of win share percentage.
A better way to visualize the data is shown below in the pie chart. Not surprisingly, the core-4 of next year’s team (Westbrook, George, Adams, Grant provided a combined 67% of total team win shares).

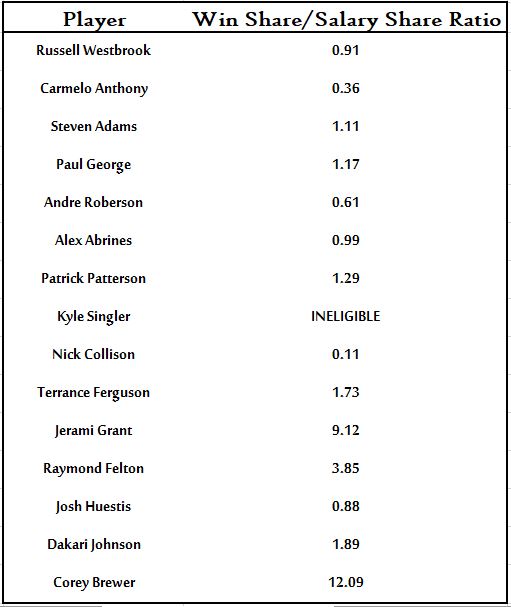
After these parameters are calculated, I evaluated a player’s contract by finding the ratio of win share percentage to salary share percentage. If that ratio is greater than the value of 1, then the player outperformed his contract for the 2017-2018 season; if that ratio is less than the value of 1, then the player underperformed his contract for the 2017-2018 season. I interpreted values of ±0.1 from the benchmark value of 1 as a contract that is justified; in other words, the player performed on par to his contract.
So, let’s take a look as to how each Thunder player performed in comparison to his contract:

Important takeaways:
- To no one’s surprise, Carmelo severely underperformed his contract.
- Jerami Grant, Raymond Felton, and Corey Brewer were the Thunder’s best value contract players.
- As expected, Andre Roberson severely underperformed his contract due to an injury.
I want to now delve more into point (3). Obviously, every team hopes that its assets are 100% operational. Barring injury, let’s examine how each player performed by extrapolating their 48-minute win share value (the 48-minute win share value is how many win shares each player would contribute for each 48 minutes).
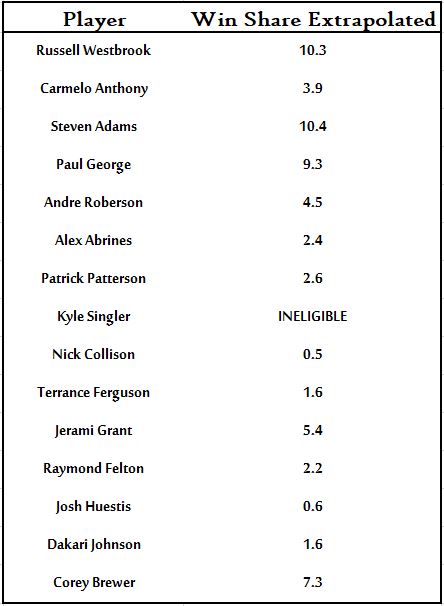
How to calculate an extrapolation? With each player, I looked at how many minutes/game a player played. I then divided this value by 48 minutes (each game consists of 4 12-minute quarters). I multiplied that ratio by each individual’s 48-minute win share, and with that result, I multiplied by 82 (the number of games in a season). This value now extrapolates how many win shares each player would contribute if the player played the full season with the team. Listed below is a table of extrapolated win share values, if that player was to play all 82 games.
Some interesting observations about these values:
- If Steven Adams played the full season, he would actually be the team’s leader in win shares (10.4), just edging Russell Westbrook (10.3).
- Andre Roberson would record a win share of 4.5. If we once again examine the ratio of win share %/salary share %, his ratio would be 0.99. This means if he played the whole season, his performance would have justified his contract.
- Perhaps the most impressive number is Corey Brewer. He played 18 games with the Thunder. However, if he played the full season, he would have recorded 7.3 win shares. Interestingly enough, he would have outperformed Andre Roberson as a starter. Not only that, he would’ve had the 4th highest win share behind Russell Westbrook; Steven Adams; and Paul George.
Any good data analyst understands that statistics doesn’t tell the whole story. It’s always good to supplement statistics with an “eye-test.” For example, Andre’s win shares seem rather meager, but all Thunder fans observed how the team had the highest winning percentage by month with him fully healthy in December.
Overall, I’d claim that the Thunder had a total of 4 bad contracts for the 2017-2018 season: Carmelo Anthony; Andre Roberson; Nick Collison; and Josh Huestis. The risks for having bad contracts for Nick Collison and Josh Huestis are marginal because their salaries were <2% of the total team salary. Furthermore, if Andre Roberson was fully healthy, he would have justified his contract. Therefore, the only bad contract on the team was Carmelo Anthony. Verdict: Thunder front office seems to have had a good year last year.
